An overall data analysis solution comprises many components, from the databases, data warehouses, data silos, and even file shares to a central repository or warehouse of trusted data and finally to the visualization and/or enterprise reporting platform, usually Microsoft Power BI, to ensure ease of use for the entire organization.
Most of the content in this blog post comes directly from Microsoft sources (documentation, architectural guidance, etc.), but it’s all consolidated here in this post for your convenience.
What is Data Analytics?
Data analysis is the process of identifying, cleaning, transforming, and modeling data to discover meaningful and useful information. Data-driven organizations make decisions based on the insights that their data provides, and in today’s data-driven world, data is not being used to its full potential, a challenge that most organizations face. Data analysis is, and should be, a critical aspect of all organizations to help determine the impact to their organization, including evaluating customer sentiment, performing market and product research, and identifying trends or other data insights.
The industry data analysis is usually defined by three (3) to five (5) types of analytics. Microsoft provides technologies for all five (5) types of data analysis, primarily, and more economically, in the Azure cloud. While the process of data analysis focuses on the tasks of cleaning, modeling, and visualizing data, the concept of data analysis and its importance to an organization should not be understated. To analyze data, core components of analytics are divided into the following categories, usually progressing in a maturity fashion:
- Descriptive
- Diagnostic
- Predictive
- Prescriptive
- Cognitive
Descriptive Analytics – What has happened?
Descriptive analytics help answer questions about what has happened based on historical data. Descriptive analytics techniques summarize large datasets to describe outcomes to stakeholders.
By developing objects like key performance indicators (KPIs), these strategies can help track the success or failure of key objectives. Metrics such as return on investment (ROI) are used in many industries, and specialized metrics are developed to track performance in specific industries.
Diagnostic Analytics – Why did it happen?
Diagnostic analytics help answer questions about why events happened. Diagnostic analytics techniques supplement basic descriptive analytics, and they use the findings from descriptive analytics to discover the cause of these events. Then, performance indicators are further investigated to discover why these events improved or became worse. Generally, this process occurs in three steps:
- Identify anomalies in the data. These anomalies might be unexpected changes in a metric or a particular market.
- Collect data that’s related to these anomalies.
- Use statistical techniques to discover relationships and trends that explain these anomalies.
Predictive Analytics – What will happen?
Predictive analytics help answer questions about what will happen in the future. Predictive analytics techniques use historical data to identify trends and determine if they’re likely to recur. Predictive analytical tools provide valuable insight into what might happen in the future. Techniques include a variety of statistical and machine learning techniques such as neural networks, decision trees, and regression.
Prescriptive Analytics – What actions should be taken to achieve a goal?
Prescriptive analytics help answer questions about which actions should be taken to achieve a goal or target. By using insights from predictive analytics, organizations can make data-driven decisions. This technique allows organizations to make informed decisions in the face of uncertainty. Prescriptive analytics techniques rely on machine learning strategies to find patterns in large datasets. By analyzing past decisions and events, organizations can estimate the likelihood of different outcomes.
Cognitive Analytics – What might happen if circumstances change?
Cognitive analytics attempt to draw inferences from existing data and patterns, derive conclusions based on existing knowledge bases, and then add these findings back into the knowledge base for future inferences, a self-learning feedback loop. Cognitive analytics help you learn what might happen if circumstances change and determine how you might handle these situations.
Inferences aren’t structured queries based on a rules database; rather, they’re unstructured hypotheses that are gathered from several sources and expressed with varying degrees of confidence. Effective cognitive analytics depend on machine learning algorithms and will use several natural language processing concepts to make sense of previously untapped data sources, such as call center conversation logs and product reviews.
Progression or Maturity of Analytics Types
If you notice the descriptions above of the types of analytics from Microsoft, each type typically builds on the previous type (i.e. Predictive and Prescriptive analytics require Descriptive analytics data (usually historically based collection) and is more accurate the more data is gathered and analyzed.
Roles in Data Analysis
Microsoft sees a growth in the number of roles involved with Enterprise Data Analysis and has defined them as five (5) roles:
- Business analyst
- Data analyst
- Data engineer
- Data scientist
- Database administrator
In the recent past, roles such as business analysts and business intelligence developers were the standard for data processing and understanding. However, excessive expansion of the size and different types of data has caused these roles to evolve into more specialized sets of skills that modernize and streamline the processes of data engineering and analysis.
Today’s applications and projects can be large and intricate, often involving the use of skills and knowledge from numerous individuals. Each person brings a unique talent and expertise, sharing in the effort of working together and coordinating tasks and responsibilities to see a project through from concept to production.
Business Analyst
While some similarities exist between a data analyst and business analyst, the key differentiator between the two roles is what they do with data. A business analyst is closer to the business and is a specialist in interpreting the data that comes from the visualization. Often, the roles of data analyst and business analyst could be the responsibility of a single person.
Data Analyst
A data analyst enables businesses to maximize the value of their data assets through visualization and reporting tools such as Microsoft Power BI. Data analysts are responsible for profiling, cleaning, and transforming data. Their responsibilities also include designing and building scalable and effective data models (shared datasets) and enabling and implementing the advanced analytics capabilities into reports for analysis. A data analyst works with the pertinent stakeholders to identify appropriate and necessary data and reporting requirements, and then they are tasked with turning raw data into relevant and meaningful insights.
A data analyst is also responsible for the management of Power BI assets, including reports, dashboards, workspaces, and the underlying datasets that are used in the reports. They are tasked with implementing and configuring proper security procedures, in conjunction with stakeholder requirements, to ensure the safekeeping of all Power BI assets and their data.
Data analysts work with data engineers to determine and locate appropriate data sources that meet stakeholder requirements. Additionally, data analysts work with the data engineer and database administrator to ensure that the analyst has proper access to the needed data sources. The data analyst also works with the data engineer to identify new processes or improve existing processes for collecting data for analysis.
Data Engineer
Data engineers provision and set up data platform technologies that are on-premises and in the cloud. They manage and secure the flow of structured and unstructured data from multiple sources. The data platforms that they use can include relational databases, nonrelational databases, data streams, and file stores. Data engineers also ensure that data services securely and seamlessly integrate across data services. Primary responsibilities of data engineers include the use of on-premises and cloud data services and tools to ingest, egress, and transform data from multiple sources. Data engineers collaborate with business stakeholders to identify and meet data requirements. They design and implement solutions.
Data Scientist
Data scientists perform advanced analytics to extract value from data. Their work can vary from descriptive analytics to predictive analytics. Descriptive analytics evaluate data through a process known as exploratory data analysis (EDA). Predictive analytics are used in machine learning to apply modeling techniques that can detect anomalies or patterns. These analytics are important parts of forecast models.
Descriptive and predictive analytics are only partial aspects of data scientists’ work. Some data scientists might work in the realm of deep learning, performing iterative experiments to solve a complex data problem by using customized algorithms.
Database Administrator
A database administrator implements and manages the operational aspects of cloud-native and hybrid data platform solutions that are built on Microsoft Azure data services and Microsoft SQL Server. A database administrator is responsible for the overall availability and consistent performance and optimizations of the database solutions. The role of a database administrator is different from the role of a data engineer. A database administrator monitors and manages the overall health of a database and the hardware that it resides on, whereas a data engineer is involved in the process of data wrangling, in other words, ingesting, transforming, validating, and cleaning data to meet business needs and requirements.
Data Analysis Tasks
The following figure shows the five key areas that you’ll engage in during the data analysis process.

Prepare
Data preparation is the process of taking raw data and turning it into information that is trusted and understandable. It involves, among other things, ensuring the integrity of the data, correcting wrong or inaccurate data, identifying missing data, converting data from one structure to another or from one type to another, or even a task as simple as making data more readable.
Model
When the data is in a proper state, it’s ready to be modeled. Data modeling is the process of determining how your tables are related to each other. This process is done by defining and creating relationships between the tables. From that point, you can enhance the model by defining metrics and adding custom calculations to enrich your data. Creating an effective and proper data model is a critical step in helping organizations understand and gain valuable insights into the data. An effective data model makes reports more accurate, allows the data to be explored faster and more efficient, decreases time for the report writing process, and simplifies future report maintenance.
Visualize
The reports that are created during the visualization task help businesses and decision makers understand what that data means so that accurate and vital decisions can be made. Reports drive the overall actions, decisions, and behaviors of an organization that is trusting and relying on the information that is discovered in the data.
Analyze
Advanced analytics enables organizations to ultimately drive better decisions throughout the business and create actionable insights and meaningful results. With advanced analytics, organizations can drill into the data to predict future patterns and trends, identify activities and behaviors, and enable teams to ask the appropriate questions about their data.
Previously, analyzing data was a difficult and intricate process that was typically performed by data engineers or data scientists. Today, Power BI makes data analysis accessible, which simplifies the data analysis process. Users can quickly gain insights into their data by using visuals and metrics directly from their desktop and then publish those insights to dashboards so that others can find needed information.
Manage
The management of the content helps to foster collaboration between teams and individuals. Sharing and discovery of your content is important for the right people to get the answers that they need. It is also important to help ensure that items are secure. You want to make sure that the right people have access and that you are not leaking data past the correct stakeholders.
Proper management can also help reduce data silos within your organization. Data duplication can make managing and introducing data latency difficult when resources are overused. Power BI helps reduce data silos with the use of shared datasets, and it allows you to reuse data that you have prepared and modeled. For key organizational data, endorsing a dataset as certified can help to ensure trust in that data.
Modern Data Analytics Architecture
Organizations face a choice when modernizing their on-premises data warehouses for the cloud. They can adopt big data tools for future extensibility, or keep traditional, SQL-based solutions for cost efficiency, ease of maintenance, and smooth transition. However, a hybrid approach combines easy migration of the existing data estate with the opportunity to add big data tools and processes for some use cases. SQL-based data sources can keep running in the cloud and continue to modernize as appropriate.

A simple architectural overview of advanced analytics is shown in the following diagram and demonstrates a high-level method of how to combine any data at any scale, and to build and deploy custom data analytics at scale.
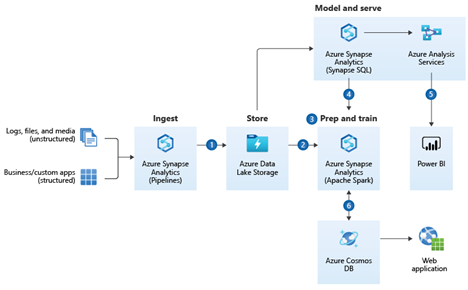
Dataflow
- Bring together all your structured, unstructured, and semi-structured data (logs, files, and media) using Synapse Pipelines to Azure Data Lake Storage.
- Use Apache Spark pools to clean and transform structureless datasets and combine them with structured data from operational databases or data warehouses.
- Use scalable machine learning/deep learning techniques, to derive deeper insights from this data using Python, Scala, or .NET, with notebook experiences in Apache Spark pool.
- Apply Apache Spark pool and Synapse Pipelines in Azure Synapse Analytics to access and move data at scale.
- Query and report on data in Power BI.
- Take the insights from Apache Spark pools to Cosmos DB to make them accessible through web and mobile apps.
Components
Not all components listed below are required. For example, Azure Cosmos DB is not a typically required component unless needing to globally distribute data.
- Azure Synapse Analytics is the fast, flexible, and trusted cloud data warehouse that lets you scale, compute, and store elastically and independently, with a massively parallel processing architecture.
- Synapse Pipelines allows you to create, schedule, and orchestrate your ETL/ELT workflows.
- Azure Blob storage and Azure Data Lake Storage Gen2 is a massively scalable object storage for any type of unstructured data-images, videos, audio, documents, and more-easily and cost-effectively.
- Azure Synapse Analytics Spark pools is a fast, easy, and collaborative Apache Spark-based analytics platform.
- Azure Cosmos DB is a globally distributed, multi-model database service. Learn how to replicate your data across any number of Azure regions and scale your throughput independent from your storage.
- Azure Synapse Link for Azure Cosmos DB enables you to run near real-time analytics over operational data in Azure Cosmos DB, without any performance or cost impact on your transactional workload, by using the two analytics engines available from your Azure Synapse workspace: SQL Serverless and Spark Pools.
- Azure Analysis Services is an enterprise grade analytics as a service that lets you govern, deploy, test, and deliver your BI solution with confidence.
- Power BI is a suite of business analytics tools that deliver insights throughout your organization. Connect to hundreds of data sources, simplify data prep, and drive unplanned analysis. Produce visually engaging reports, then publish them for your organization to consume on the web and across mobile devices.
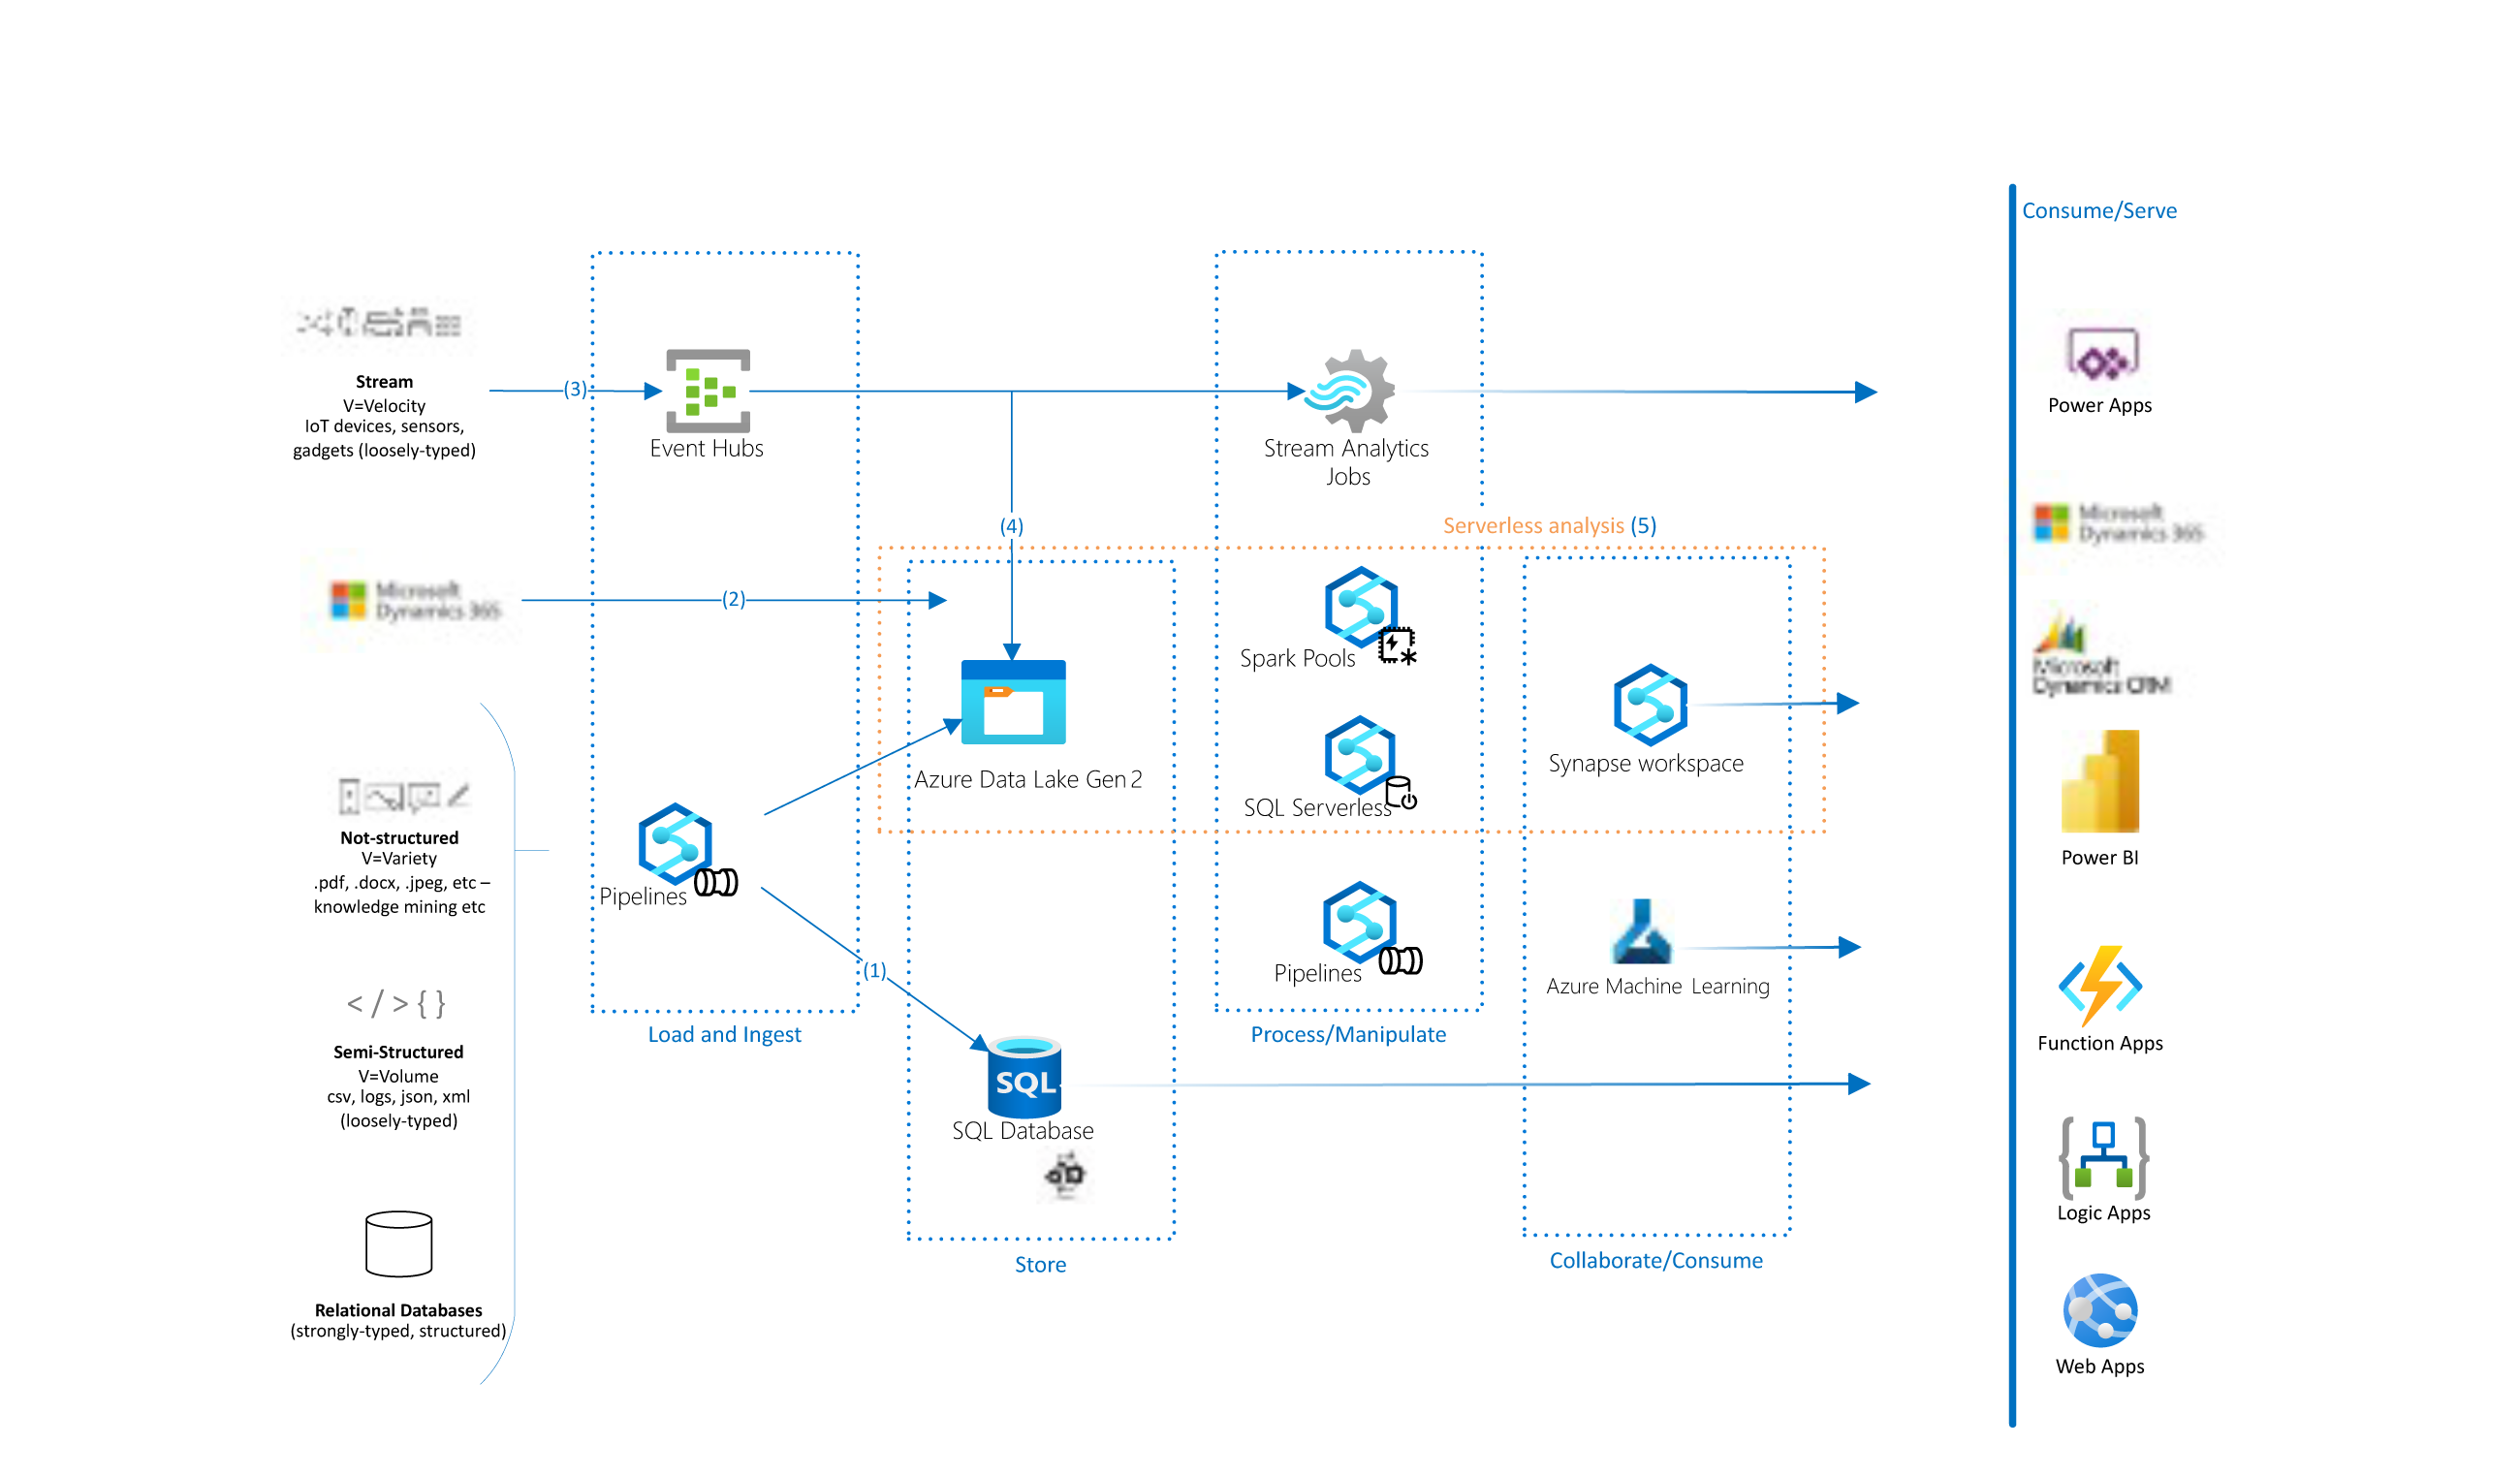
Expanding on the above, the following example workload shows several ways that organizations can modernize legacy data stores and explore big data tools and capabilities, without extending current budgets and skillsets. These end-to-end Azure data services integrate easily with Azure and Microsoft services and tools like Azure Machine Learning, Microsoft Power Platform, and Microsoft Dynamics.
Legacy data sources might contain several types of data:
- Unstructured data, like documents and graphics
- Semi-structured data, such as logs, CSVs, JSON, and XML files
- Structured relational data, including databases that use stored procedures for extract-transform-load/extract-load-transform (ETL/ELT) activities
In this expansion of capabilities, the following data flow demonstrates the ingestion of the chosen data type:
- Azure Synapse Analytics pipelines ingest the legacy data warehouses into Azure.
- The pipelines orchestrate the flow of migrated or partially refactored legacy databases and SSIS packages into Azure SQL Database. This lift-and-shift approach is fastest to implement, and offers a smooth transition from an on-premises SQL solution to an eventual Azure platform-as-a-service (PaaS). You can modernize databases incrementally after the lift and shift.
- The pipelines can also pass unstructured, semi-structured, and structured data into Azure Data Lake Storage for centralized storage and analysis with other sources. Use this approach when fusing data provides more business benefit than simply re-platforming the data.
- Microsoft Dynamics data sources can be used to build centralized BI dashboards on augmented datasets using Synapse Serverless analysis tools. You can bring the fused, processed data back into Dynamics and Power BI for further analysis.
- Real-time data from streaming sources can also enter the system via Azure Event Hubs. For customers with real-time dashboard requirements, Azure Stream Analytics can analyze this data immediately.
- The data can also enter the centralized Data Lake for further analysis, storage, and reporting.
- Serverless analysis tools are available in the Azure Synapse Analytics workspace. These tools use serverless SQL pool or Apache Spark compute capabilities to process the data in Data Lake Storage. Serverless pools are available on demand, and don’t require any provisioned resources.
Serverless pools are ideal for:
- Ad hoc data science explorations in T-SQL format.
- Early prototyping for data warehouse entities.
- Defining views that consumers can use, for example in Power BI, for scenarios that can tolerate performance lag.
Azure Synapse is tightly integrated with potential consumers of your fused datasets, like Azure Machine Learning. Other consumers can include Power Apps, Azure Logic Apps, Azure Functions apps, and Azure App Service web apps.
Components
- Azure Synapse Analytics is an analytics service that combines data integration, enterprise data warehousing, and big data analytics. In this solution:
- An Azure Synapse Workspace promotes collaboration between data engineers, data scientists, data analysts, and business intelligence (BI) professionals.
- Azure Synapse pipelines orchestrate and ingest data into SQL Database and Data Lake Storage.
- Azure Synapse serverless SQL pools analyze unstructured and semi-structured data in Data Lake Storage on demand.
- Azure Synapse serverless Apache Spark pools do code-first explorations in Data Lake Storage with Spark languages like Spark SQL, pySpark, and Scala.
- Azure SQL Database is an intelligent, scalable, relational database service built for the cloud. In this solution, SQL Database holds the enterprise data warehouse and performs ETL/ELT activities that use stored procedures.
- Azure Event Hubs is a real-time data streaming platform and event ingestion service. Event Hubs can ingest data from anywhere, and seamlessly integrates with Azure data services.
- Azure Stream Analytics is a real-time, serverless analytics service for streaming data. Stream Analytics offers rapid, elastic scalability, enterprise-grade reliability and recovery, and built-in machine learning capabilities.
- Azure Machine Learning is a toolset for data science model development and lifecycle management. Machine Learning is one example of the Azure and Microsoft services that can consume fused, processed data from Data Lake Storage.
Alternative Components
- Azure IoT Hub could replace or complement Event Hubs. The solution you choose depends on the source of your streaming data, and whether you need cloning and bidirectional communication with the reporting devices.
- As an alternative, Azure Data Factory could be used for data integration instead of Azure Synapse pipelines. The choice depends on several factors:
- Azure Synapse pipelines keep the solution design simpler, and allow collaboration inside a single Azure Synapse workspace.
- Azure Synapse pipelines don’t support SSIS packages rehosting, which is available in Azure Data Factory.
- Synapse Monitor Hub monitors Azure Synapse pipelines, while Azure Monitor can monitor Data Factory.
- Synapse Analytics dedicated SQL pools can be used for storing enterprise data, instead of using SQL Database.
Conclusion
Microsoft Azure Data Analytics and supporting services, including Power BI, can assist your organization in getting a handle on all the data sources within your organization in providing an enterprise data analytics platform including key visual insights into the data. However, it is important to properly plan and implement it to ensure maximum organizational value.
In speaking with clients, I usually start by stating Azure Synapse is more of a brand than a single technical service, since it encompasses ingestion, storage, preparing, and modeling.
As an experienced Microsoft Gold Certified Partner with numerous Data and Cloud specialties and Advanced Specializations, Planet Technologies can assist your organization in planning, designing, and implementing data analytics modernization and transformation, all the while ensuring your team’s ongoing ability to not only maintain, but continue to refine the entire data analytics flow. We do that by ensuring throughout all engagements industry leading knowledge transfer, so your organization can continue its maturation in managing your data analytics solutions.
Learn More
- Planet’s Microsoft Managed Services
- Evolve 365
- Planet’s Microsoft Expertise
- Planet’s Microsoft Accelerators
Something else or not sure where to start? Email us at [email protected]
